Features
Every check your team actually needs.
Website, API, heartbeat and SSL monitoring — with analytics, alerts and configuration built for real production workloads.
The dashboard
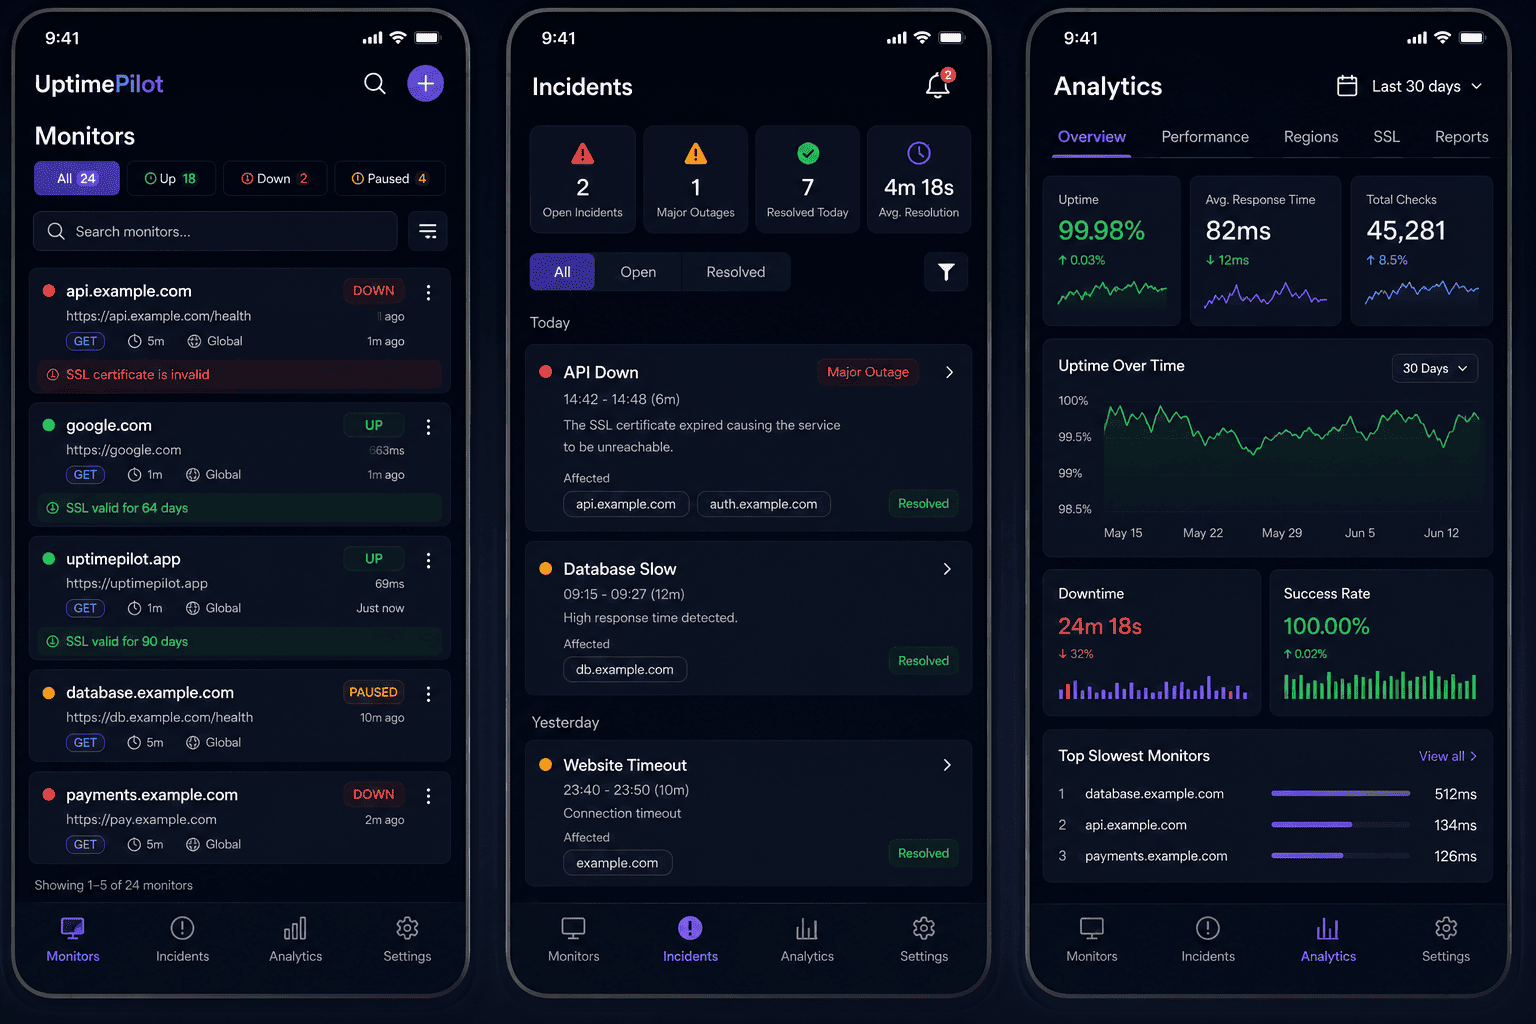
Monitor Everything. All in One Dashboard.
A single, calm view of every service you care about — with the details you actually need one tap away.
Live monitor overview
See every website, API and heartbeat at a glance.
Search monitors
Filter by status and jump straight to what matters.
Current status
Up, down, paused — colour-coded and always fresh.
Response time
Track latency for every check, every region.
SSL status
See certificate validity right next to the monitor.
Uptime overview
Percentages and trends over meaningful timeframes.
Configuration
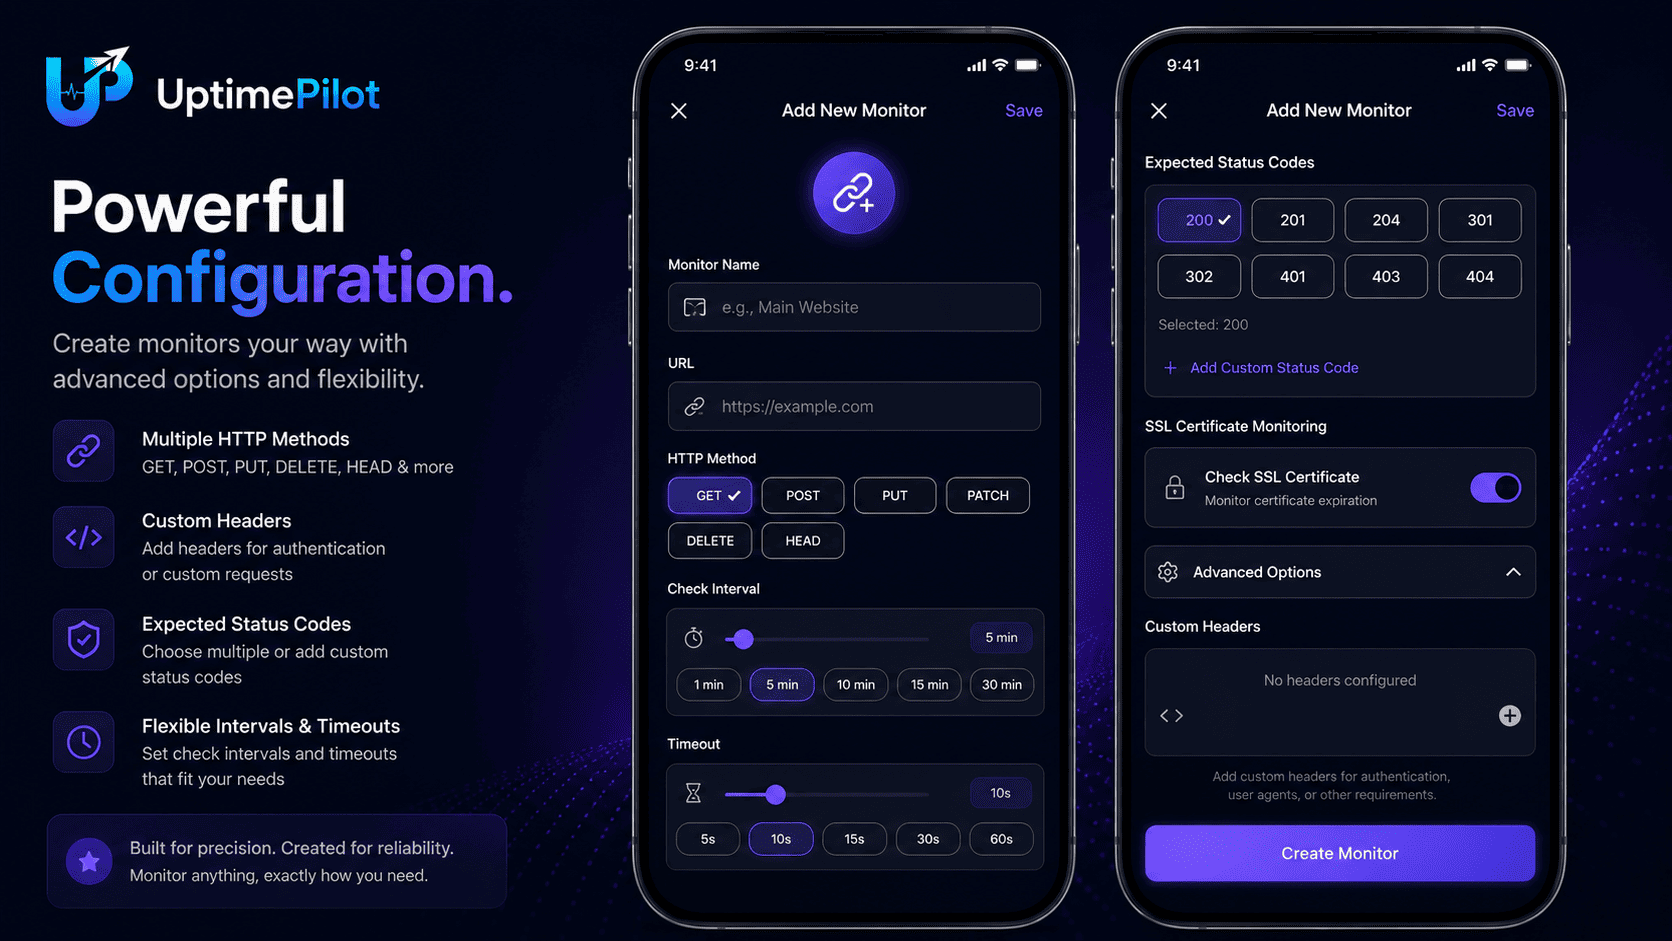
Powerful Configuration.
Create monitors your way with advanced options and flexibility. Sensible defaults for the common case, real control when you need it.
HTTP & HTTPS Monitoring
Watch any public URL with keyword and status assertions.
Heartbeat Monitoring
Monitor cron jobs, scheduled tasks, workers and background scripts.
SSL Monitoring
Get alerted before certificates expire — no more Sunday surprises.
Custom HTTP Methods
GET, POST, PUT, PATCH, DELETE and HEAD — pick what your endpoint expects.
Expected Status Codes
Choose which status codes count as healthy for each monitor.
Custom Headers
Send auth tokens, API keys or any custom header your endpoint needs.
Flexible Intervals
From tight production checks to relaxed background jobs.
Timeouts
Fine-tune per-monitor timeouts to match how your service behaves.
Monitor details
Monitor Details. Full Visibility.
Every monitor comes with the context you need to diagnose an issue without opening five tabs.
SSL certificate information
Issuer, validity window and days until expiry.
Response time graph
Watch how latency changes across your check interval.
Uptime percentage
Precise availability numbers for the periods that matter.
Historical performance
Look back across days, weeks and months of checks.
Incident history
Every downtime event with duration, cause and recovery time.
Last check status
See exactly what your monitor returned on its most recent run.
Analytics
Performance & Uptime Analytics.
Charts that answer the questions your team actually asks — how reliable is this service, and is it getting better or worse?
Response Time Trends
See how latency evolves over any period, per monitor.
Uptime Statistics
Availability numbers you can share with your team.
Historical Analytics
Compare recent performance to previous weeks and months.
Incident Overview
Every incident, grouped and easy to review.
Reliability Insights
Understand what's stable and what needs attention.
Alerts
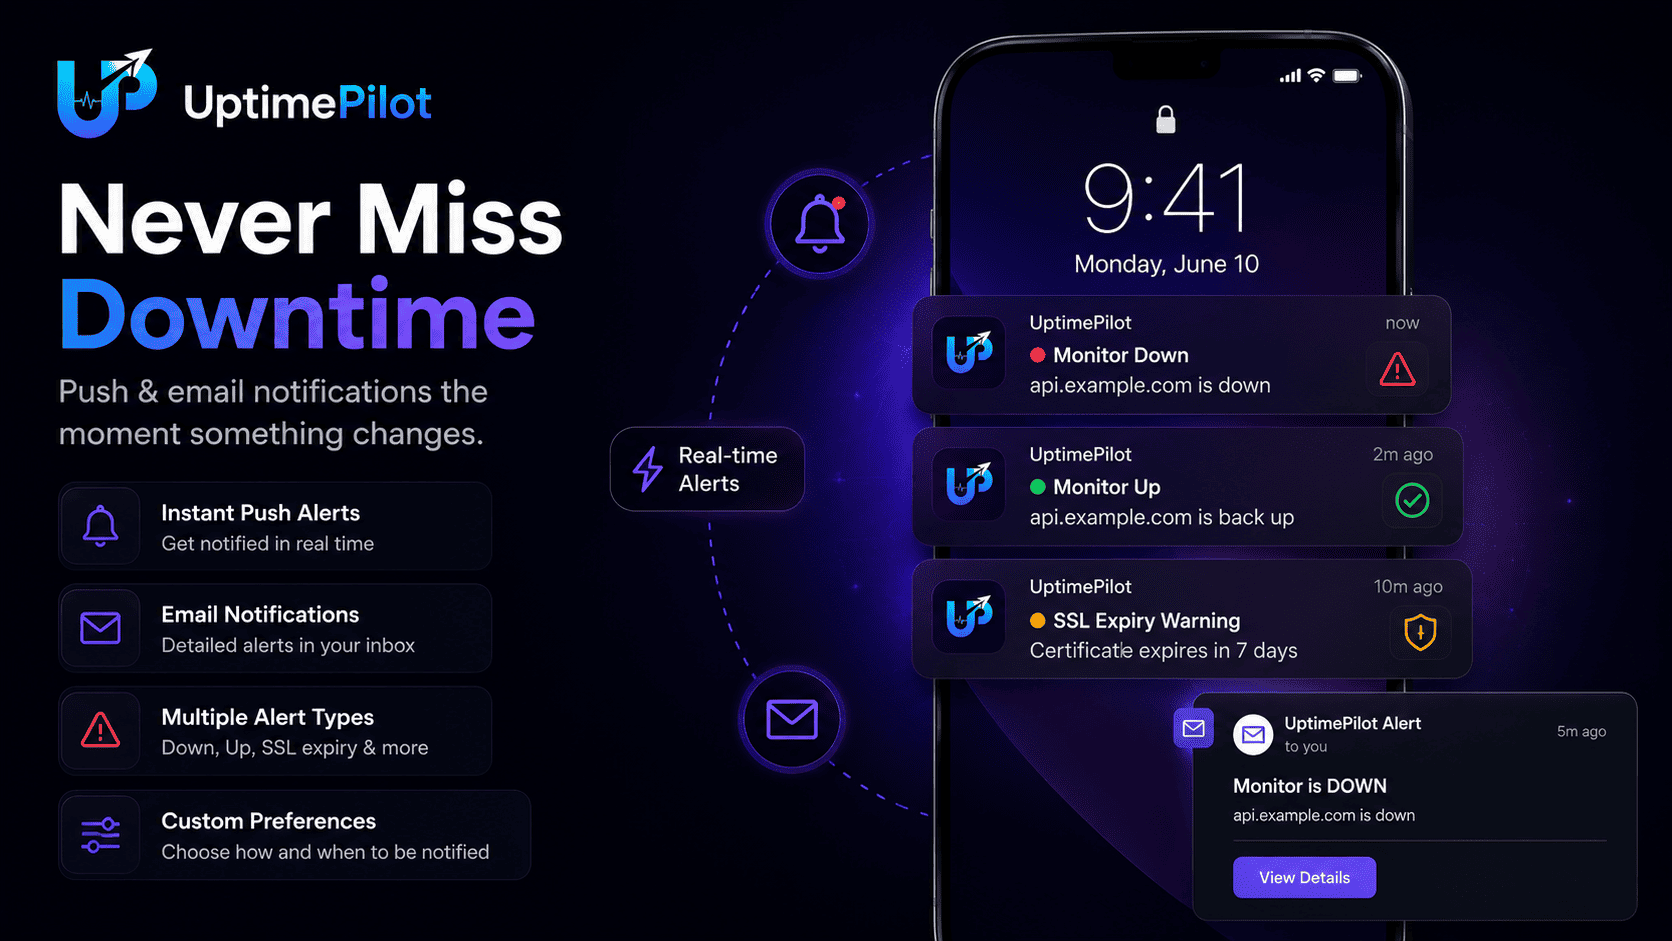
Never Miss Downtime.
Push and email notifications the moment something changes — with recovery alerts when everything's healthy again.
Instant Push Notifications
The moment a check fails, you know.
Email Notifications
Detailed alerts land in your inbox with full context.
SSL Expiry Alerts
Get warned days ahead of a certificate expiring.
Recovery Notifications
Know exactly when a monitor is back up.
Trust
Built for Reliability.
UptimePilot is designed to be dependable. No inflated statistics, no marketing theatre — just careful engineering and honest choices.
Reliable monitoring
Checks run on a durable, multi-region infrastructure.
Accurate alerts
Confirmation logic keeps false alarms out of your inbox.
Secure infrastructure
Encrypted storage and least-privilege access by default.
Continuous improvements
New capabilities land regularly, driven by real usage.
Stop wondering.
Start monitoring.
Free to use · no credit card