Know when something breaks.
Monitor your APIs, websites and background jobs with UptimePilot. Get push and email alerts when a service goes down or a scheduled job stops reporting.
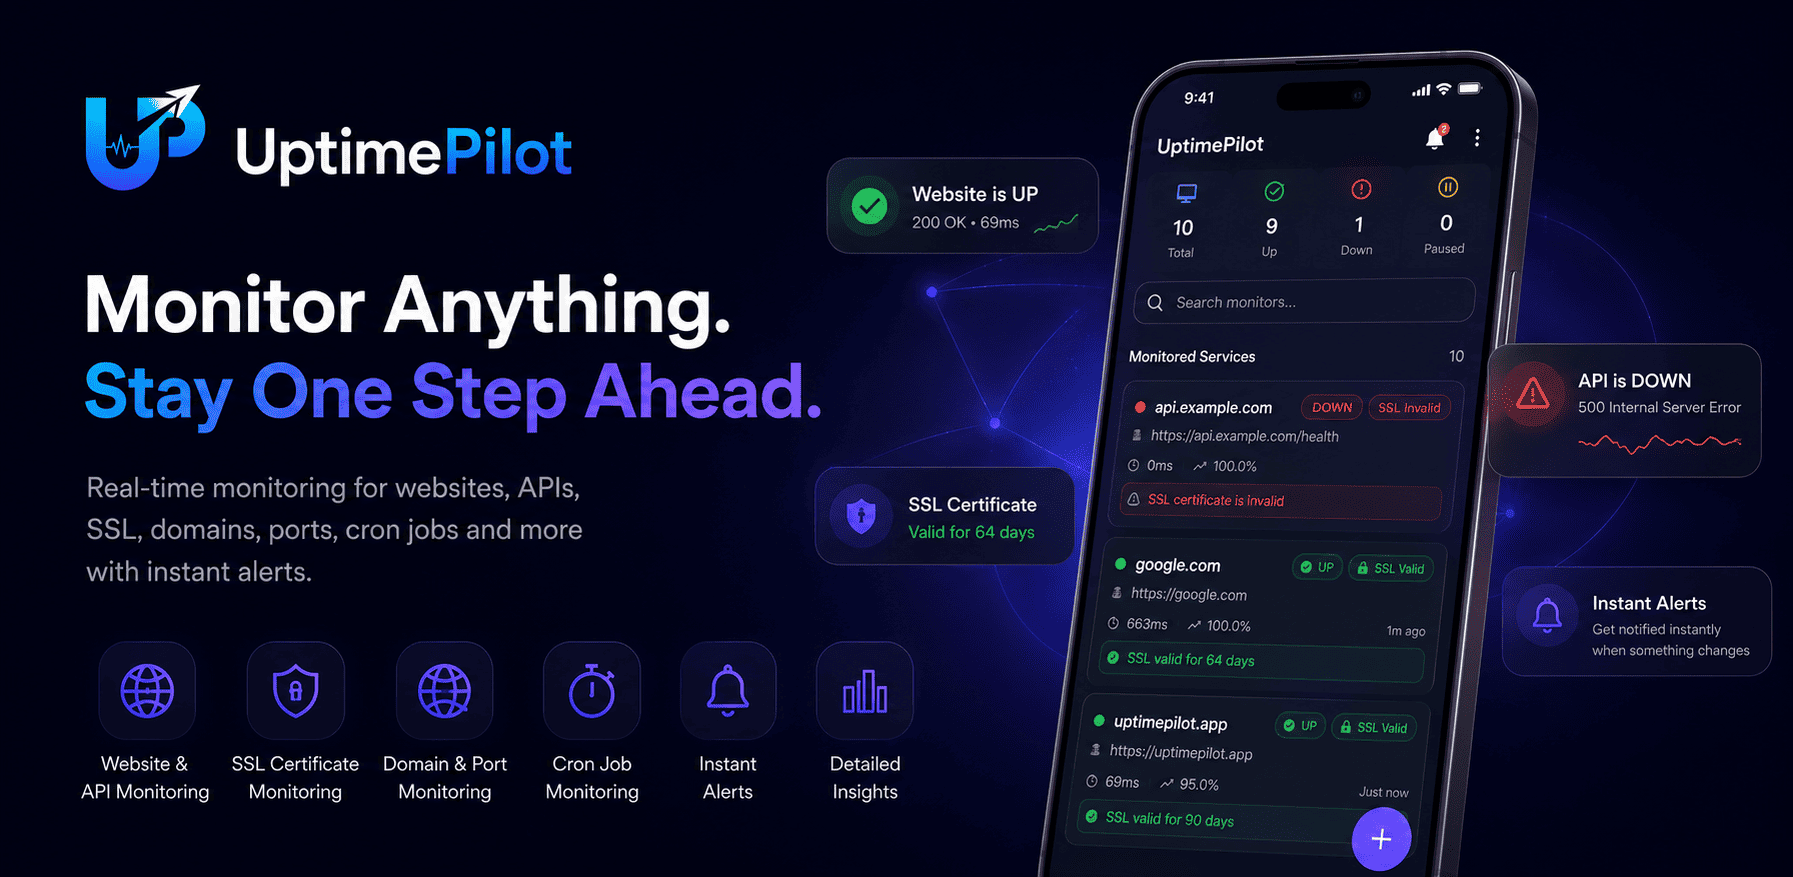
HTTP / HTTPS Monitoring
Your site is down and you're the last to know.
An endpoint starts returning 500s at 3am. Nobody notices until a customer emails hours later. UptimePilot checks your URL on the interval you choose and shows you exactly where the check failed.
UptimePilot check
- ✓DNSResolved
- ✓ConnectionEstablished
- ✓TLS / SSLValid
- ✕HTTP 503Service Unavailable2.84s
GET /api/health
- ✕Monitor marked DOWN
Every stage is traced
DNS, connection, TLS and the request itself — each with its own result.
The failure is named
Not "something went wrong": the status code, reason and response time.
You get alerted
A push notification and email land before your users complain.
Notifications
Alerts that reach you where you actually are.
Monitoring is only useful if the alert reaches a human. UptimePilot sends push notifications straight to your phone and email notifications with the full context of what changed — including a recovery alert when the service is healthy again.
UP
Monitor healthy
DOWN
Check fails
DETECT
Failure confirmed
ALERT
Push + email sent
RECOVER
Back up, you're told
Push notifications
Delivered instantly to your device the moment a monitor changes state.
Email notifications
A written record of what failed, when it failed and when it recovered.
Use cases
What developers actually point it at.
Two things people use HTTP monitoring for every day.
Public APIs and websites
Watch your landing page, checkout flow or REST endpoints. Set the expected status code, add auth headers, and know immediately when a response stops looking right.
- GET, POST, PUT, PATCH, DELETE, HEAD
- Expected status codes
- Custom headers and timeouts
Keeping serverless apps warm
Free-tier and serverless hosts put idle apps to sleep. A short check interval keeps the instance awake, so the first real visitor doesn't wait on a cold start.
- Configurable check intervals
- Response time recorded per check
- Multi region checks you select
Heartbeat Monitoring
Did your job actually run?
Some failures are silent. A cron job that never fires throws no error and returns no status code — it simply doesn't happen. Heartbeat monitoring flips the direction: your job pings UptimePilot, and if the ping doesn't arrive in time, you get alerted.
Send a payload with the ping
Heartbeats can carry a payload, so the ping isn't just "I ran" — it can record what the run actually did. That context is stored with the check and visible in the app.
curl -X POST https://…/heartbeat/<id> \
  -H "Content-Type: application/json" \
  -d '{"status":"ok","rows":128400,"size":"2.4GB"}'
Good for anything scheduled
- Database backups
- Cron jobs and scheduled tasks
- Queue workers and background scripts
- Data syncs and nightly reports
Which one do I need?
HTTP checks out. Heartbeats check in.
Both catch downtime — they just point in opposite directions.
The dashboard
Monitor Everything. All in One Dashboard.
A single, calm view of every service you care about — with the details you actually need one tap away.
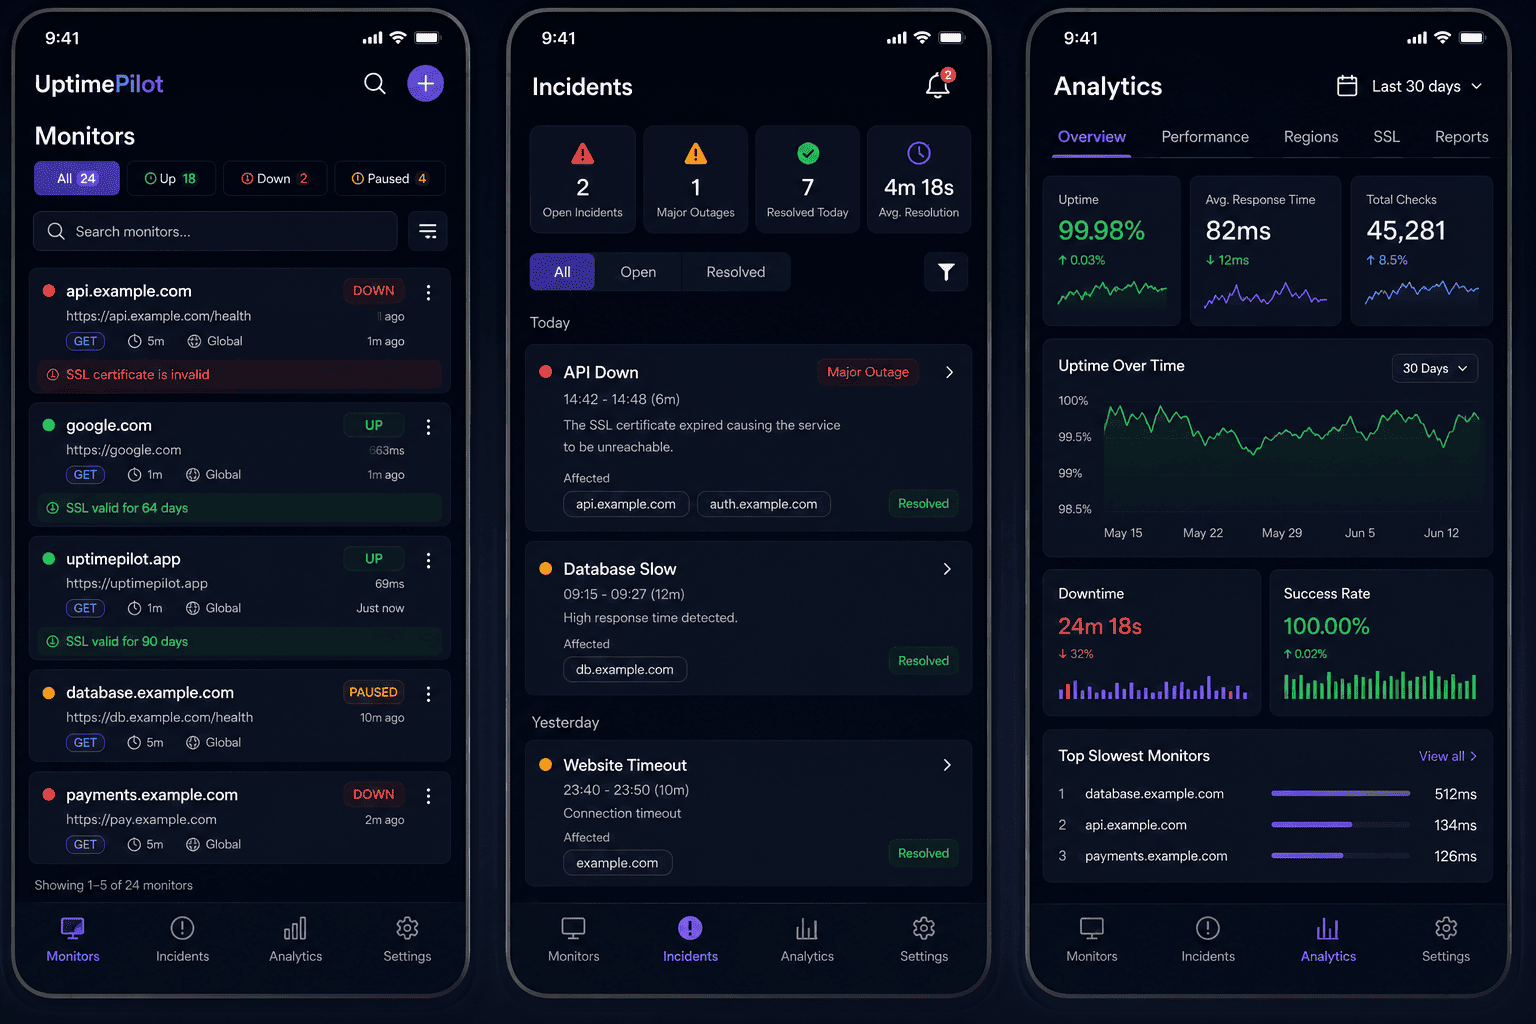
Live monitor overview
See every website, API and heartbeat at a glance.
Search monitors
Filter by status and jump straight to what matters.
Current status
Up, down, paused — colour-coded and always fresh.
Response time
Track latency for every check, every region.
SSL status
See certificate validity right next to the monitor.
Uptime overview
Percentages and trends over meaningful timeframes.
Configuration
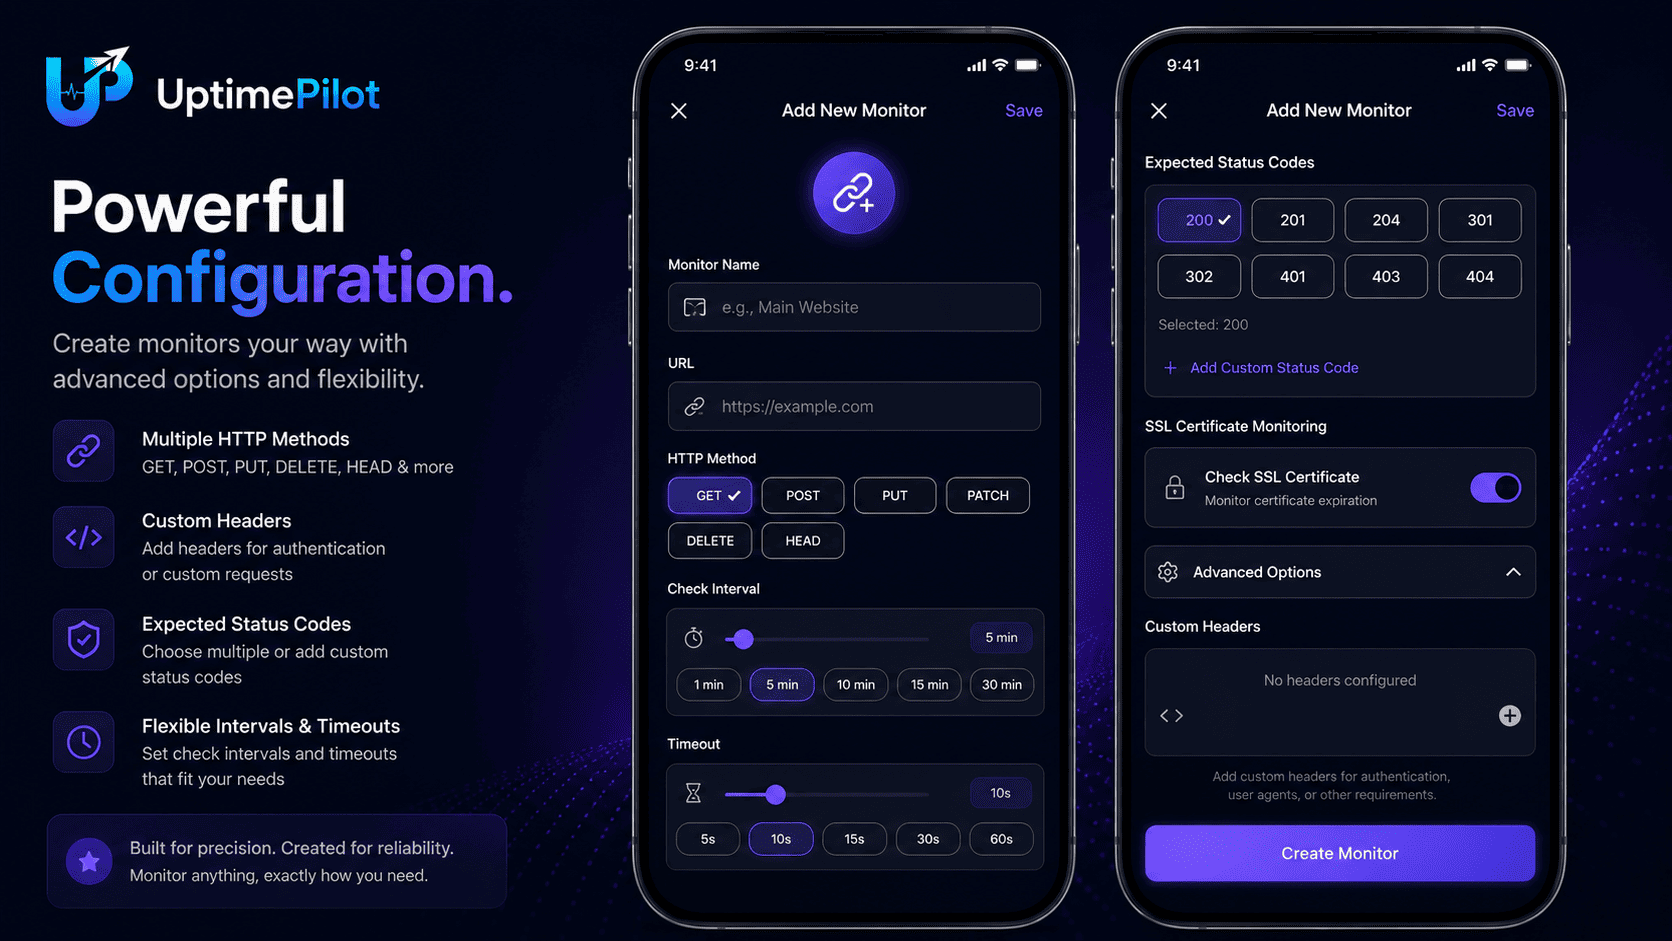
Powerful Configuration.
Create monitors your way with advanced options and flexibility. Sensible defaults for the common case, real control when you need it.
HTTP & HTTPS Monitoring
Watch any public URL with keyword and status assertions.
Heartbeat Monitoring
Monitor cron jobs, scheduled tasks, workers and background scripts.
SSL Monitoring
Get alerted before certificates expire — no more Sunday surprises.
Custom HTTP Methods
GET, POST, PUT, PATCH, DELETE and HEAD — pick what your endpoint expects.
Expected Status Codes
Choose which status codes count as healthy for each monitor.
Custom Headers
Send auth tokens, API keys or any custom header your endpoint needs.
Flexible Intervals
From tight production checks to relaxed background jobs.
Timeouts
Fine-tune per-monitor timeouts to match how your service behaves.
Monitor details
Monitor Details. Full Visibility.
Every monitor comes with the context you need to diagnose an issue without opening five tabs.
SSL certificate information
Issuer, validity window and days until expiry.
Response time graph
Watch how latency changes across your check interval.
Uptime percentage
Precise availability numbers for the periods that matter.
Historical performance
Look back across days, weeks and months of checks.
Incident history
Every downtime event with duration, cause and recovery time.
Last check status
See exactly what your monitor returned on its most recent run.
Analytics
Performance & Uptime Analytics.
Charts that answer the questions your team actually asks — how reliable is this service, and is it getting better or worse?
Response Time Trends
See how latency evolves over any period, per monitor.
Uptime Statistics
Availability numbers you can share with your team.
Historical Analytics
Compare recent performance to previous weeks and months.
Incident Overview
Every incident, grouped and easy to review.
Reliability Insights
Understand what's stable and what needs attention.
Alerts
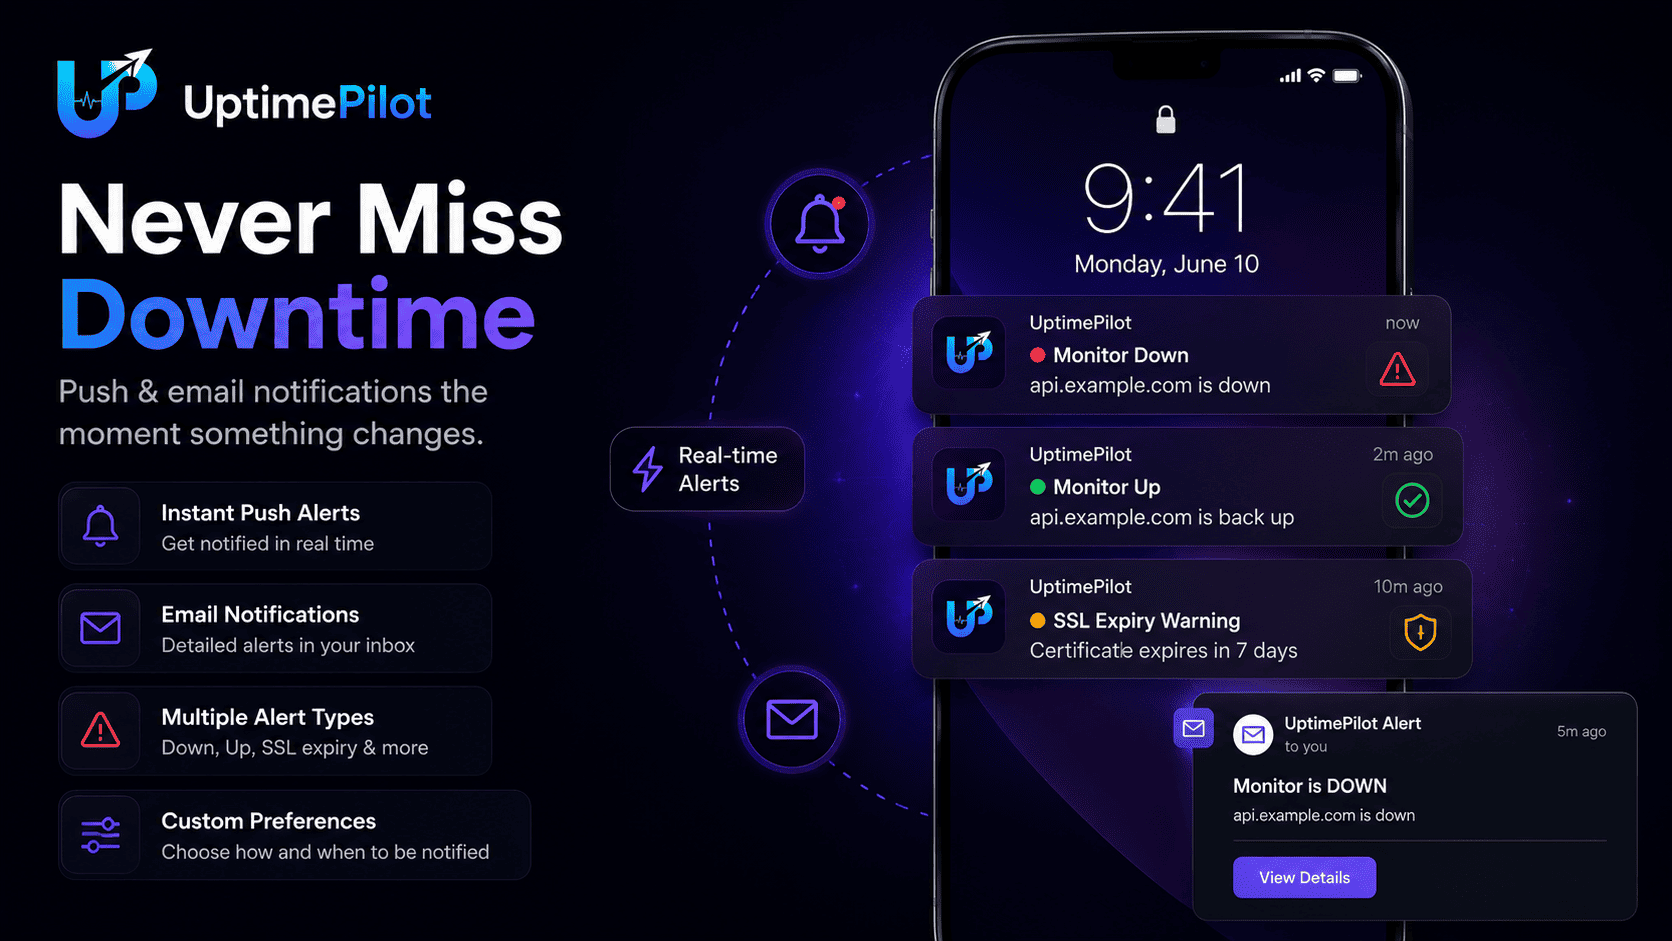
Never Miss Downtime.
Push and email notifications the moment something changes — with recovery alerts when everything's healthy again.
Instant Push Notifications
The moment a check fails, you know.
Email Notifications
Detailed alerts land in your inbox with full context.
SSL Expiry Alerts
Get warned days ahead of a certificate expiring.
Recovery Notifications
Know exactly when a monitor is back up.
Trust
Built for Reliability.
UptimePilot is designed to be dependable. No inflated statistics, no marketing theatre — just careful engineering and honest choices.
Reliable monitoring
Checks run on a durable, multi-region infrastructure.
Accurate alerts
Confirmation logic keeps false alarms out of your inbox.
Secure infrastructure
Encrypted storage and least-privilege access by default.
Continuous improvements
New capabilities land regularly, driven by real usage.
Roadmap
What's Next.
We're continuously improving UptimePilot based on community feedback. Upcoming improvements include:
- Additional monitoring types
- More analytics
- Better notification controls
- Expanded platform support
We ship when things are ready — no promised release dates.
Start monitoring today.
UptimePilot is available on Google Play and free to use right now. Create a monitor, point it at a URL or a scheduled job, and get alerted the moment something changes.
No credit card. No pricing games. Just monitoring.
FAQ
Questions, answered.
What can I monitor?+
Websites (HTTP/HTTPS), APIs, SSL certificates and heartbeat endpoints for cron jobs, scheduled tasks, workers and background scripts.
Does UptimePilot support Heartbeat Monitoring?+
Yes. Give each cron job, scheduled task or worker a unique URL, ping it when it succeeds, and get alerted when a ping doesn't arrive on time.
Does it support SSL monitoring?+
Yes. UptimePilot monitors SSL certificate expiry so you get warned well before renewal is due.
Can I monitor APIs?+
Yes. Configure custom HTTP methods (GET, POST, PUT, PATCH, DELETE, HEAD), custom headers, expected status codes, intervals and timeouts.
Can I receive push notifications?+
Yes. Push notifications are delivered instantly to your phone the moment a monitor's status changes.
Can I receive email alerts?+
Yes. Email notifications include full context on what changed and when.
Is there a free plan?+
Yes. The Free plan includes 10 monitors, a 3-minute checking interval and 15 days of log retention, with no card required.
How much do the paid plans cost?+
In India, Starter is ₹299/month and Pro is ₹699/month. In other regions, Starter is $6.99/month and Pro is $13.99/month.
Can I change my plan later?+
Yes. You can upgrade or downgrade at any time, and your monitors keep running until the end of the billing period.
Which platforms are supported?+
UptimePilot ships as a mobile application, available now on Google Play.
Stop wondering.
Start monitoring.
Free to use · no credit card